Bitcoin’s price gained by 119% in 2024. Will Bitcoin go up in 2025? Read more for our 2025 Bitcoin price analysis:
Leveraging human expertise and advanced AI tools, we’ve conducted a comprehensive analysis to uncover key insights. This analysis explores the key trends, support and resistance levels, and market behavior that have defined Bitcoin’s journey over the past year.
Bitcoin Technical Analysis: 2024
- Trend Analysis
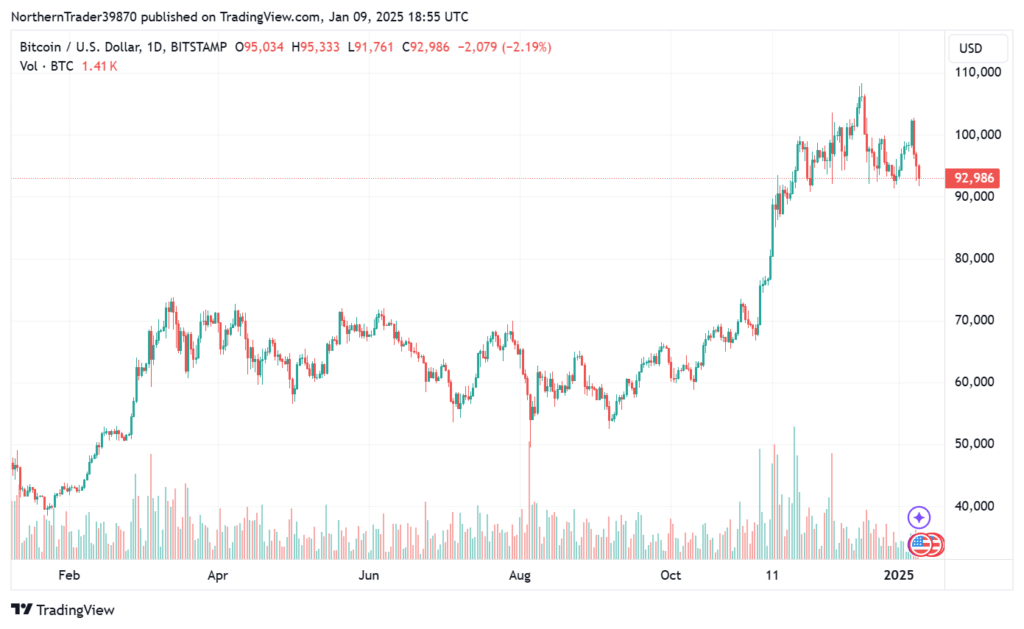
- Overall Trend: Bitcoin has maintained a clear uptrend throughout much of the year, characterized by higher highs and higher lows, particularly in the second half.
- Recent Action: After peaking above $100,000, Bitcoin is undergoing a correction, with its price currently around $92,986, reflecting a short-term downtrend.
- Key Support and Resistance Levels
- Support:
- $90,000 appears to be a crucial short-term support level.
- If the price dips further, previous consolidation zones between $80,000 and $85,000 may act as stronger support.
- Resistance:
- The recent peak of ~$100,000 serves as a significant resistance level.
- Intermediate resistance is present around $95,000, where selling pressure has emerged in recent sessions.
- Support:
- Volume Analysis
- Volume spikes are evident during major price moves, indicating strong market participation during breakouts and corrections.
- Declining volume during the recent pullback suggests waning selling pressure, which could signal a potential pause in the correction phase.
- Candlestick Patterns
- A potential evening star pattern is visible near the peak, signaling possible trend reversal or consolidation.
- The recent series of red candles indicates bearish momentum, although the lack of long wicks suggests a controlled correction rather than panic selling.
- Moving Averages (Assumed Analysis)
- The 50-day moving average is likely above the 200-day moving average, confirming a long-term bullish trend.
- A pullback toward the 50-day MA may present a potential bounce point if the broader uptrend holds.
- Indicators (RSI and MACD Assumptions)
- The RSI likely showed overbought conditions at the recent peak, with subsequent cooling during the correction.
- The MACD may signal a bearish crossover in the short term, reflecting the ongoing downward momentum.
- Chart Patterns
- Consolidation Zones: Sideways price action earlier in the year highlights accumulation phases, which eventually led to strong breakouts.
- Breakout Levels: The breakout above $70,000 earlier in the year marked a critical turning point, driving the price to its recent highs. If Bitcoin holds the $90,000 support level and sees increased volume during upward moves, it could retest $100,000 and move beyond. A decisive break below $90,000 might trigger further downside toward the $80,000-$85,000 support zone.
Price Analysis for 2025
Based on the technical indicators and Bitcoin’s historical price action, here are the projected price targets for 2025:
- Bullish Price Target
- $120,000 – $150,000
- This scenario assumes Bitcoin resumes its uptrend after the current correction and benefits from continued adoption, institutional interest, and favorable macroeconomic conditions. Historically, Bitcoin has demonstrated the ability to rally 1.5x to 2x past key resistance levels, which positions $150,000 as an achievable target in a bullish market.
- $120,000 – $150,000
- Bearish Price Target
- $70,000 – $85,000
- In this scenario, Bitcoin fails to maintain its $90,000 support and enters a prolonged correction. Broader market pressures, regulatory challenges, or reduced liquidity could push the price back to its previous consolidation zones.
- $70,000 – $85,000
- Median Price Target
- $100,000 – $110,000
- A neutral outlook suggests Bitcoin stabilizes around key psychological levels, consolidating near $100,000. This reflects moderate growth, balancing between bullish and bearish catalysts.
- $100,000 – $110,000
These projections reflect varying market conditions and depend heavily on factors such as institutional adoption, macroeconomic trends, and regulatory developments. Investors should closely monitor market behavior, volume, and key support/resistance levels as the year unfolds.
This content is for educational purposes only. It does not constitute trading advice. Past performance does not indicate future results. Do not invest more than you can afford to lose. The author of this article may hold assets mentioned in the piece.